More course activity analysis tools

I’ve written before about the tools I’ve built to manage the workload and gather statistics on activity of students in my Data Structures and Algorithms course.

To recap, the tool is needed due to large number of students in the course (and others, going on simultaneously), while the teaching resources are quite petite, to put it mildly. Last year the total enrolment count was ~350, this Fall it is ~230. Repository count this year is (currently) ~200.

What kind of activity statistics? Like the total number of daily commits from the start of the course, done by students:
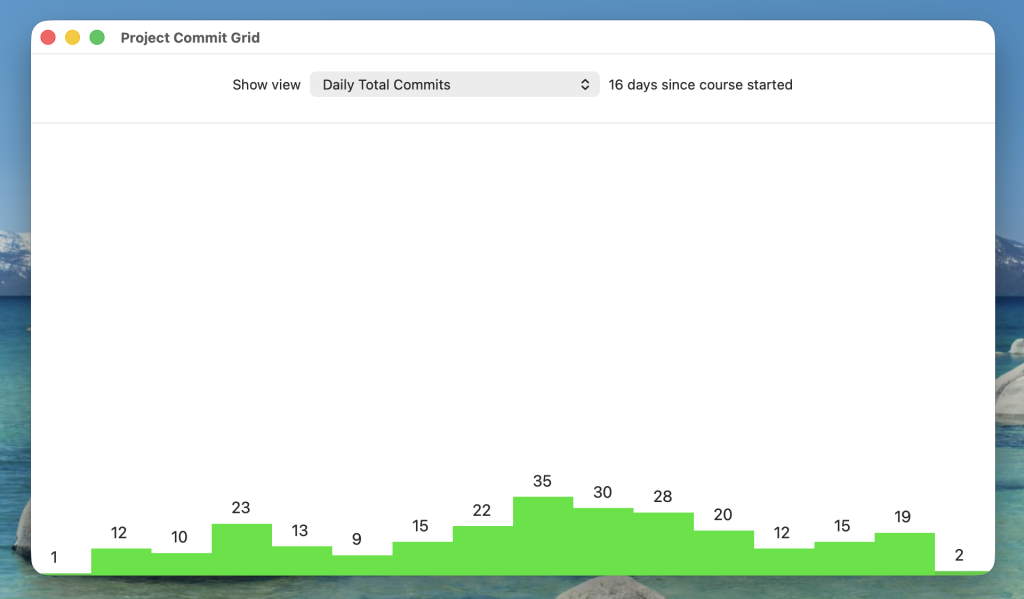
Bar chart of count of git commits per day in a programming course with ca. 200 students.

Someone made a git commit on the first day of the course, and the most active day so far was the ninth day with 35 commits in total.

Or the repositories having a specific count of commits currently:
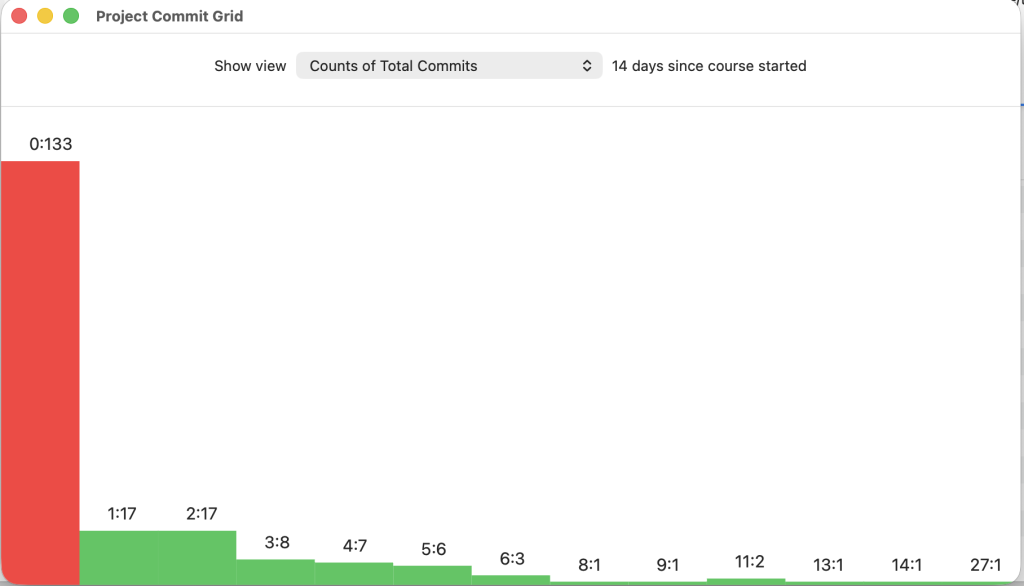
Bar chart displaying the count of student git remote repositories having a specific number of commits so far. Zero commits in remote repository accessible to teachers does not indicate zero work. Student may have commits in their local repository or uncommitted work not yet in git.

The graph above shows that 133 repositories have zero commits at the time this analysis was done, 17 repositories have one commit, etc. The most active student has done 27 commits already.

This data graph shows what have the students been working on during the last seven days:
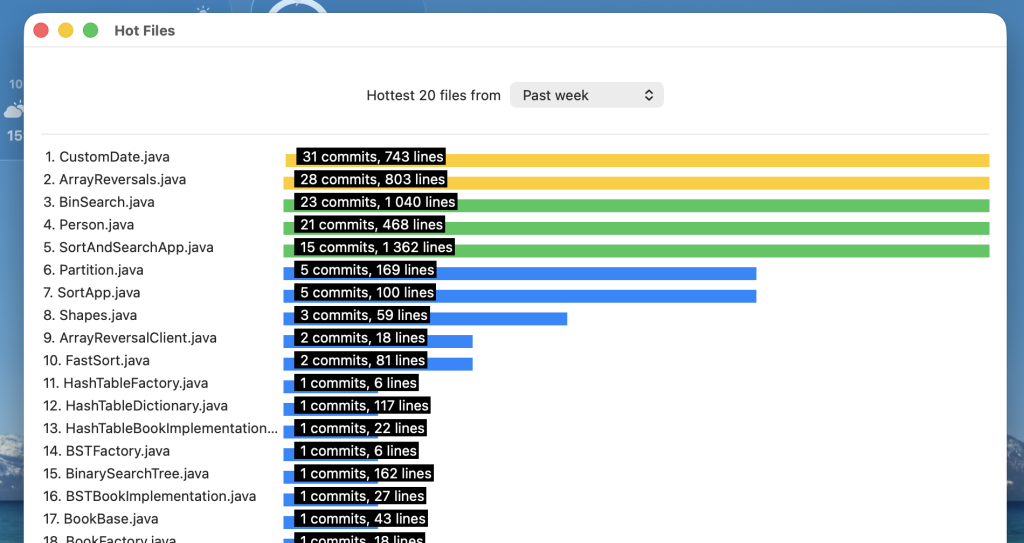
A chart displaying the most actively edited files based on commit counts and changed lines in all student repositories.

Which looks quite what is expected, since the first five Java files are supposed to be worked upon in the first three course programming tasks in the schedule this and previous course weeks.

These are all based on my Swift/SwiftUI app analysing the data from git and git logs, either stored in my app’s database or parsing from the output of git log command, as the analysis is executed and the graphs are generated.

But what about the activities related to the lectures? Assumption is, obviously, that the students first go through the lectures and lecture demonstrations and only then dwell into the associated programming tasks. An assumption that does not unfortunately always hold, but still…

We use Moodle as the learning environment. While Moodle has extensive and detailed tools to analyse and observe student activities, getting a quick overview from those tools can be a bit cumbersome.

For example, when you view the activity log of a link to a lecture video in Moodle, you can see who and when has accessed that link. But if the same student clicks the activity’s link several times, there are several rows in the activity log for the same student. Also, that log does not quickly tell me the total count of students who have accessed the lecture video at least once. I’d have to do the counting myself manually.

I’ve split the lecture videos to a manageable lengths (from the viewing perspective) which means there are 25 video links currently of the actual lecture content. In addition to that, there are some demonstration videos. Clicking through the Moodle analytics on all of these and counting by hand how many students have accessed the videos is therefore not something I’d do e.g. weekly. Too much manual, tedious and error prone work.

This is not a one time chore, but a thing to do many, many times during the course. Preferably weekly from September to December. Then the teachers would be on the map about the students advancing in the course, week by week.

Using the analytics data, we at least theoretically could be able to observe something relevant happening (or something not happening what was supposed to happen!) that could indicate problems somewhere in the course implementation. Maybe the data could also be used to improve the course for the next year, pinpointing places where the planned schedule and actual realities do not match and it is the course schedule that should be adjusted.

Fortunately, Moodle offers a download link for each activity log report. I can choose the format of the downloaded file, one of which is JSON. So, I implemented (no LLMs used, as usual!) a command line tool using Swift, which

  1. reads the downloaded Moodle JSON analytics files from a specified directory,
  2. reads the activity name from the JSON file contents,
  3. counts the unique student names in that file, and then
  4. updates a tab separated values (tsv) file where the statistics (no student data is stored) of each Moodle activity are stored, per analysis date, and
  5. the tsv file can be opened in a spreadsheet app and data can be visualised as a graph:
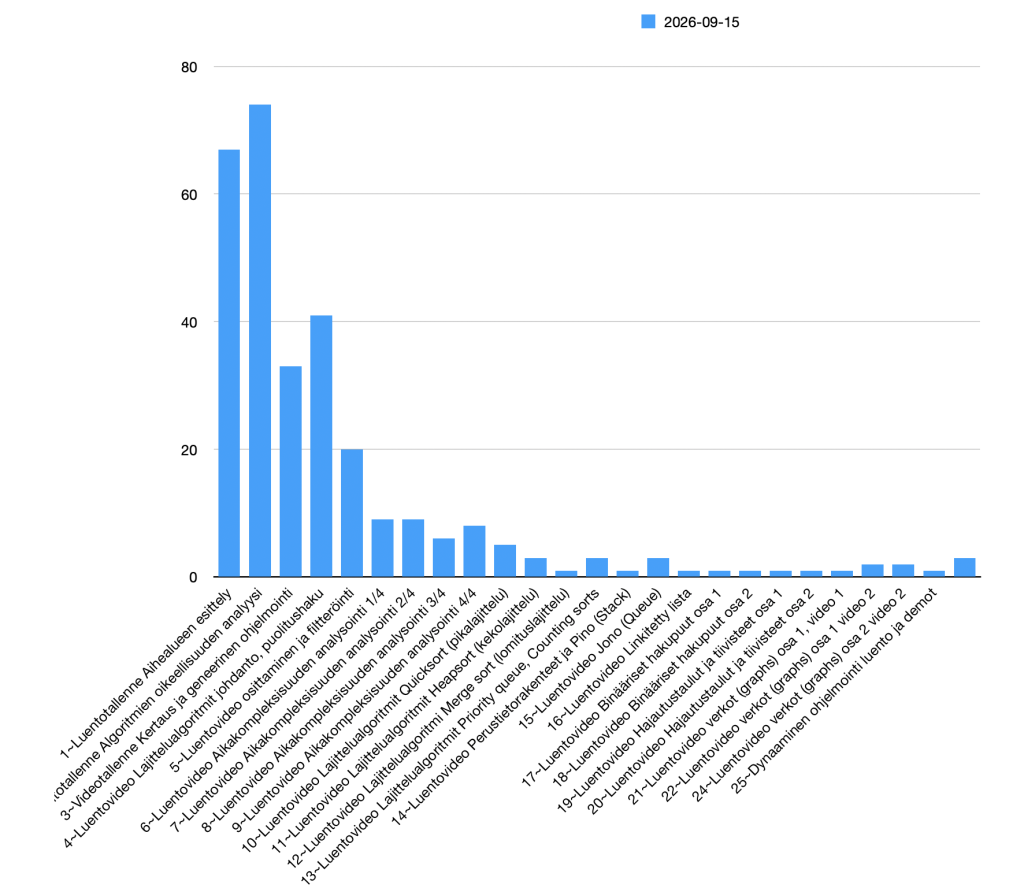
A bar chart displaying the Moodle activity access counts of course lecture videos, gathered from Moodle activity logs. The chart tells me that many students have not yet started to watch the lecture videos but are falling a bit behind of the schedule. Not yet alarmingly so, but let’s see how it goes. It is always possible that some watch videos together, only one student accessing the activity while many are actually watching. A very good thing in itself, but may influence the statistics.

The relevant part of the JSON file handling is:

func processJSONFile(_ file: String) throws -> (num: Int, act: String)? {
  let fileContents = try String(contentsOfFile: file, encoding: .utf8)
  if let jsonData = fileContents.data(using: .utf8) {
    var uniqueUserNames: Set<String> = []
    var target = "" // The Moodle activity name
			
    let jsonDecoder = JSONDecoder()
    let items = try jsonDecoder.decode([[MoodleStatisticsItem]].self, from: jsonData).flatMap( { $0 } )
			
    for item in items {
      // Ignore the listed teachers who clicked the activity link.
      if !ignoreNames.contains(item.kokoNimi) {
        uniqueUserNames.insert(item.kokoNimi)
      }
      if target.isEmpty {
          target = item.tapahtumanKonteksti.replacingOccurrences(of: "Verkko-osoite: ", with: "")
      }
    }
// ...

What is actually collected and later saved to the tsv file from this, is the uniqueUserNames.count, telling the number of individuals (excluding teachers) who have accessed the Moodle activity at the time the tool was executed, as well as the name of the Moodle activity from within the JSON file, in target.

Now, instead of spending tens of minutes or even hours, clicking and manually counting things from the Moodle activity logs, I’ll spend maybe 5 minutes max to download the JSON log files actually only like seconds, since I just changed the tool to handle just one JSON file containing all activities of the course, and one second to execute the tool and open the resulting file in the spreadsheet app. Huge time savings!

All this done, by the way, when I was (still am) sick from a flu and can’t go teach in the classroom. Implementation took less than a workday. No employer’s time wasted doing this, just my sick day, but saving employer paid work time later! [Do not work when sick. I did because I like programming and didn’t consider this work, actually, but an interesting problem to solve.]

When I used the tool first time, the resulting graph above shows the activity stats of course lecture videos for that date, Sept 15th. I plan to launch the tool once a week, so it is then possible to see the difference to last weeks’ viewing stats. The next time launched, a new entry is added to tsv file for that date stats.

Knowing the recommended course schedule, I can then use the tool to see how the students actually advance through the course lectures. This should also give more insight into the git based programming task analytics.

If, for example, the graph above shows that students are advancing into the Stack data structure lectures a week after the planned schedule, teachers could expect that the students are actively starting the related coding tasks that week or the next one. Then we could be better prepared to handle the inevitable issues and questions about stacks at that time. Or we could anticipate that when the deadline comes, a certain number of student are behind the schedule and may need additional support to actually pass the deadline without issues. Hopefully.

The only manual thing left to do is to actually download those 25 Moodle activity JSON log files. I bet I could somehow record a script that does that clicking and selecting type of downloads in the browser automatically too… 🤔

Preparing for DSA course in Fall 2026

I’ve been working on modifications to the Data Structures and Algorithms (DSA) course during this Spring. This is another attempt to make it more possible than before to pass the course for more students than in the past. (A complicated way to say that I am trying to make it easier to pass the course.)

The last programming task on Graphs has previously included implementing the basic graph features (adding vertices and edges) as well as basic algorithms (breadth and depth first searches) and finally Dijkstra’s shortest path algorithm.

Next course implementation gives the students already implemented Directed and Undirected Graph implementations with necessary algorithms. I’ll give the implementations as an obfuscated jar file though, not source code.

Instead of implementing the mentioned algorithms, they’ll use the given algorithms to solve problems. Let’s see if this helps in growing the pass percentage of the course.

The use case story in the new graph programming task is such that…:

“The Finns have grown frustrated to the way things are heading on Earth and have decided to leave the planet, to conquer a little piece of the Galaxy for themselves. Finns have mapped an area of stars and are now planning and budgeting how many portals between pairs of stars they need to build to enable traveling between stars in this little system of theirs.”

Since the Finns are lead by someone from Laihia (the Scotland of Finland), everything must be done as cheaply as possible. So the first problem is to calculate the distances between all the stars, pair at a time, and then arrange them so that the closest pairs are first. Because then the portals are built so that the closest pair of two stars is connected first, then the second closest, etc. This makes building cheaper since not only the two portals needed have a cost, but the cost of maintaining the connection increases as the distance between the stars grow. To maintain the portal connection over longer distances requires more energy, as you can surely understand.

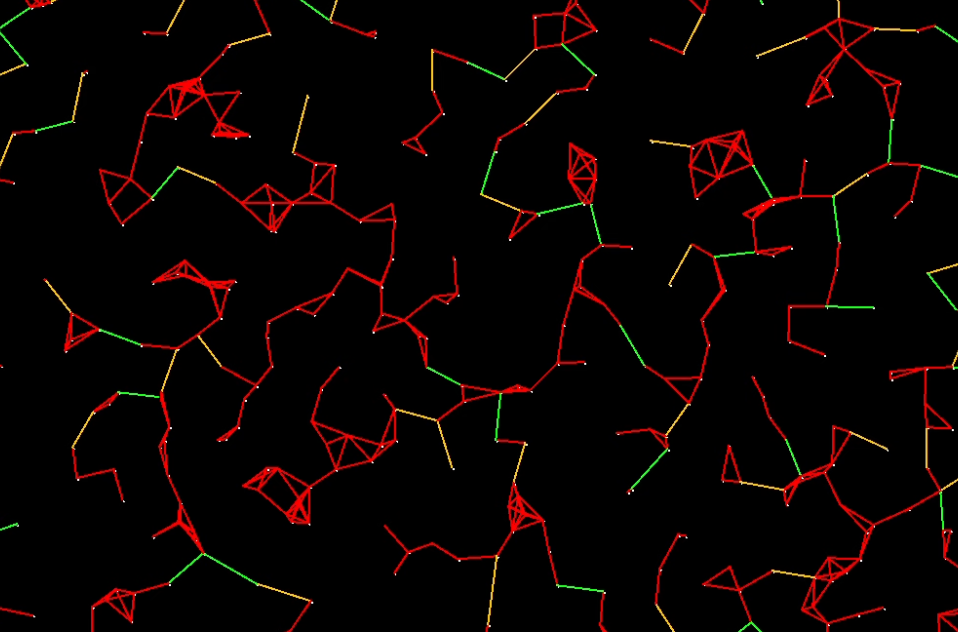
The leader has also set a limit on the number of portals to use in the first phase of conquest. After all the available portals have been used, leader wants to know how many disconnected areas we still have left. One can travel within a connected area, but one cannot travel from a connected area to another area of connected stars, as there is no portal connection between them. As you can see from the image below.

A map of the star system displaying connected areas of stars where one could travel from a star to another within the connected area. Still there are disconnected areas one cannot travel to from other areas.

Finns could then build more portals and continue to connect the still unconnected stars from the list of stars in increasing distance order. But that would create connections that are not actually needed for traveling. As you can see from the image above, connected areas contain links between stars that are redundant — one could travel from a star to another using other available connections. So to the disappointment to the leader, we have spent portals and energy to maintain connections not actually needed!

The leader then decides that the disconnected areas should be connected with only one additional portal pair to one other connected area as close as possible.

Taking first the largest connected area A (having more stars than other connected areas) should be connected to another connected area B that has a star that is nearest to some star in A than any other of the connected areas C, D, E,… has.

For example, if you take a look at the image above, and the connected area at the bottom right corner. It could be connected to the area that is above and left, since it seems to be the nearest. Or the triangular area in middle left edge should be connected to the one on the right of it — they are closest to each other.

To enable this, one must first obtain all the disconnected areas and sort them largest first, in descending order by the count of stars in the connected area. Then starting to find the closest areas to connect and do the actual connecting.

There are many ways to do this, but one is to create a minimum spanning tree forest of the graph. Minimum spanning tree has only the necessary links, stripping the redundant ones, but at this point Finns are not interested in that, just the fact that the forest has trees and these trees are disconnected.

Using these disconnected trees, Finns can find the two closest connected areas and add only two portals between two closest stars of area A and B. This connects the two disconnected areas to one larger connected area.

This connecting happens with the original first phase task graph with redundant portals and links, not with the minimum spanning tree forest. Why not with that?

Since dismantling the already built portals also has a cost. Those pesky portal builders get paid not only building things but also from dismantling things. And as the stingy Laihian leader of Finns sees an opportunity to save costs, that opportunity surely will be taken.

Additional portals (connected by green lines) are built to connect closest disconnected areas to each other.

After doing this, the whole star system should be connected. That is, you can travel from any star to another star, since there always is a path. Finns can now start counting the beans of traveling from star P to star Q. This can be done using Dijkstra’s shortest path algorithm. Some sample travel costs are then calculated.

A sample travel path has been calculated between two stars. A path was found, and as you can see, the shortest path from alternative links in areas with redundant connections was selected.

The final task is to try to see if dismantling the redundant portals and links that are not actually needed (see the image again), has a cost advantage. Could Finns sell those portals to someone else with profit and still be able to travel cheaply enough in their system or not? Note that even though the extra portals and connections have a cost, they also may provide shorter routes to travel, thus reducing the travel costs, compared to having only the minimum number of portals/connections.

At this point the whole system is connected, so Finns can again create a minimum spanning tree forest from the graph. This time the forest has only one tree, since there was no disconnected areas. This tree now replaces the original star map graph and we can calculate the costs of traveling having only the bare minimum of connections that are needed.

This starmap has redundant connections removed. Only the connections needed to keep the whole star system connected have been retained. A path can still be found between any two stars, but the cost of traveling may change compared to the previous situation.

In the end, the task is to see what if the total cost of building portals with some redundancy is cheaper compared to stripping away all redundant connections. In the evaluation, Finns need to calculate both the total cost of building and maintaining the portals, as well as traveling through the system via the shortest paths, either with redundancy or no redundancy at all.

I’ve implemented an example solution for the problems to see that the problems are solvable by the students, and so that I can then assist the student in actually solving the problem.

The video below visualizes in an animation how the different problems are solved. First, the tasks are solved one by one with a small sample star map. After this, a larger star map with 10 000 stars is selected and all tasks are solved in one go.

The learning goals include forming combinations of two of all the stars, calculating distances between them, sorting by distance, selecting a graph implementation (directed or undirected, easy peasy), adding vertices and edges to a graph, forming minimum spanning trees, merging graphs, and then doing searches for shortest paths.

Obviously making sure all is done correctly. Each student will use their own star map file the tools generate to them, and the tests will verify that their result is correct with their specific star map file.

Still WIP, have to make sure everything is easily packaged as a learning task with instructions. And automatically testable with JUnit. Teaching resources are (once again, surprise surprise /s) less than previous years, I have (once again) more work allocated than before, so automation in evaluation and support for independent work for students is really truly needed.

Open source packages in the Veikkaus app

I haven’t used the Veikkaus app for a long time, but launched it today on my iPhone. The app had been updated at some point and now wanted to have access to the local network. Which I obviously denied. Why on earth the app for gambling (lottery and such) for money would need to access my local network? Not granted.

Also, what I found interesting is that the reason for the access request was in English, not Finnish, though my device locale and language is set to Finnish, and the app otherwise is Finnish. Is this something Veikkaus messed up, or Apple? Anyways, for a normal non-tech Finnish user, the UX of this permission request was not good at all.

Anyways, that got me interested, and I tried to find a setting from the app that perhaps could tell me more. Didn’t find the setting, but saw that they list the open course components used in the app.

Using open source is always something that interests me. Especially as I was a teacher in an open source software development focused course in our curriculum – a course deprecated long time ago. I remember the first time seeing the Linux license in the papers of the new Sony TV I bought, how it astonished me at that time. That even televisions now contain open course software and include the licenses of such in their packages, on paper (at least then).

I clicked the link in the app to see the components, but for some reason, the list displayed only for a second and then disappeared. I tried again and again, but to no avail. Then I copied the link and pasted it in Safari browser in the phone. Similar issues there too.

Then I sent the link to my laptop, but also there I had the same issues. Next I resorted to curl in the terminal, redirecting the html to a file and opened that in Safari. Again, issues.

 curl https://msa.veikkaus.fi/licenses/mobile_lisenssit.html > lisenssit.html

The html itself is very simple, just the basic opening elements and then a list of the components and their licenses within a <pre> element.

I renamed the html file curl to xml and opened it in Xcode. The file is a 2.7 Mb file, containing not only the list of components the app uses, but also the different actual license texts listed. No wonder the file is so large and browsers have issues with it.

Anyways, the license texts (MIT, BSD, Apache, etc.) start from the line 1 374, after listing the open source components. Though some of the components are listed twice, with identical version numbers – don’t know why, so the true number of used components may be much smaller. Also, there are empty lines in the original html, so that also must be considered.

@adrianso/react-native-device-brightness              1.2.7         MIT                                                                                                                     
@graphql-typed-document-node/core                     3.2.0         MIT                                                                                                                     
tslib                                                 2.6.2         0BSD                                                                                                                    
@wry/context                                          0.7.3         MIT                                                                                                                     

After stripping out empty lines (and lines with whitespace characters, searching and replacing) and duplicates using sort and uniq command line tools…

 more cleaned-list.xml | sort | uniq > final.xml

… I can see that there are a total of 1 064 open source components used by the Veikkaus app, including often different versions of the same component:

@babel/compat-data                                    7.26.8        MIT
@babel/core                                           7.22.15       MIT
@babel/core                                           7.26.9        MIT
@babel/generator                                      7.22.15       MIT
@babel/generator                                      7.23.6        MIT
@babel/generator                                      7.25.6        MIT
@babel/generator                                      7.26.9        MIT
@babel/generator                                      7.28.6        MIT
@babel/helper-annotate-as-pure                        7.22.5        MIT
@babel/helper-annotate-as-pure                        7.24.7        MIT
...
which                                                 2.0.2         ISC
which-country                                         1.0.0         MIT
wonka                                                 6.3.5         MIT
wrap-ansi                                             7.0.0         MIT
wrappy                                                1.0.2         ISC
write-file-atomic                                     4.0.2         ISC
ws                                                    6.2.3         MIT
ws                                                    7.5.10        MIT
ws                                                    8.18.1        MIT
xcode                                                 3.0.1         Apache-2.0
xml2js                                                0.6.0         MIT
xmlbuilder                                            11.0.1        MIT
xmlbuilder                                            15.1.1        MIT
xtend                                                 4.0.2         MIT

I guess this is what modern software development is, nowadays. Or maybe their software BOM (Bill Of Materials) is not quite up to date, don’t know.

(You may wonder why do lottery? Well, I know very well about the odds of actually winning large sums of money. But sometimes the modern (work) life is so … so something that the hope of getting rid of it all is so overwhelming that I resort to desperate actions… The money I spend is very little, and this happens only spuriously, so no need to worry about any gaming addiction.)

Too busy for blogging

The Fall semester was again another hectic run through the courses, without much breaks. Three courses with two full time and two part time teachers helping, having nearly 900 students. No wonder…

Regarding my latest posts and this situation, I did manage to solve Advent of Code up to part 1 of day 10. Part 2 is still WIP, and I do have some ideas about that. But don’t know if and when I return to that, if ever.

Much of the teaching work at Fall was conducted not in prepared teaching sessions, since for some reason, many students nowadays do not seem to want or need to come to lectures or exercise sessions. Though we teachers sat though them all! Well we did cancel some sessions at the very end since nobody was coming, but anyways.

We even had to arrange three classroom sessions for the Fall, since last year (2024, fully online teaching) students demanded at least some face-to-face teaching for 1st year students. They even went to the Dean of the Faculty to make sure this happens.

Almost nobody came. Less than 20 students (out of ~900) from those three courses went to the classroom sessions, if I remember correctly. Not very effective use of teaching resources, IMO. Hopefully those who came found them valuable!

Well, we have video lectures and other support (Web based FAQ tool in Moodle, email), and major part of the teaching happens via these. Maybe we should be happy that the course materials and the support we do provide is enough for those students that decide to continue in the course. Some enrolled to my DSA (Data Structures and Algorithms) course do not, since they never provide the URL to their project repository or quit after first 1-2 programming assignments.

In the FAQ tool in DSA, I published 47 new FAQs in addition to the 33 old FAQs from the previous course implementations. Many of the solutions in the FAQs could have been avoided if carefully reading the course materials, watching the lectures and following the instructions in the programming assignments. Anyways, maybe the FAQs also contained explanations and points that somehow provided additional help to the students.

I also moved DSA course exams to controlled exam environment. Because of AI slop and cheating is on the rise. Some small hiccups there I need to fix, but seems to work overall.

To make preparing exams a bit more efficient, I implemented several console based tools (in Swift) that generate random Exam questions, also with image attachments. I have tools to generate questions about binary search algorithms, hash table and hashing using linear probing, as well as tools that generate questions testing if students understand how nodes are added to Binary Search Trees. And how to conduct breadth-first-search and depth-first-search to graphs.

Whenever I like, I can then generate new questions, to make sure every student has their own unique set of questions for their exams.

Today I refactored a part of my code analysis tool. The tool and the refactored feature helps me to check if the 300-something students in DSA have used solutions in their code that must be avoided or are forbidden (e.g. calling Java hashCode() when they should have implemented their own, or calculating the hash from wrong things). Or to make sure they have used elements that must or should be used (e.g. calling a function from itself, when recursive code is required). Something teachers could do manually, but since we do not have those teachers in the numbers required for manual work, automation comes to help.

The analysis code used Antrl to parse the students’ Java code to search for things that are not OK and must be OK. While it worked nicely in my Swift app, Antlr was very slow in debug builds. It was a bit faster when the app was build in release configuration, but still slow enough to be annoying.

So instead, the new implementation just runs a Java console app in a Subprocess, using the Swift Subprocess library. I implemented the same code analysis tool as a Java console app and gave that to the students, using com.github.javaparser for the source code parsing.

Using the tool, students can check, before deadlines‚ that they have not done anything stupid. Avoiding to get failed grade after the last deadline, as they can use the tool to check and fix any obvious wrong solutions during the course. Preferably before deadlines, as they will get sanctions on using solutions that are not accepted.

I needed to modify the Java app a bit so that the Swift app I use can launch it and use the output to record results to my Swift app’s database:

  • modified the command line parameters to include output format, either “text” or “json”. Default is text, so students can see more understandable output from the tool. Given the “json” parameter from my Swift app to the Java app explicitly, produces JSON formatted output my Swift tool reads from Subprocess’ stdout.
  • Make sure the Java app output to stdout contain only the JSON, containing the issues found in the code, when “json” format was selected. So the Swift app can then rely on the received output to be valid JSON.
  • Fix some issues in the code analysis output at the same time, that lead to invalid JSON. Like having unescaped quotes in the analysis output, or line endings like \r which messed the output not just in JSON but also in text format.

This change makes also sure that the Java app the students use is behaves exactly as my tool. No surprises in what the tool reports and does not report to students, compared to the results the teacher sees.

Java app executed in the subprocess executes definitely faster than the Antlr implementation in Swift. Additionally, I managed to strip down tens of lines of code, the Antlr generated Java parser removed, plus the dependency to the Antlr library from the Swift tool project is now gone.

Advent of Code 2025

Advent of Code (AoC) for this year started yesterday. I’ve been too busy with work to write here how my puzzle solving has been going. Or anything else, for that matter. Probably will be for the rest of this year.

Why busy? I’ve been moving Data structures and algorithms course exams from Moodle to Exam. Exam is a controlled environment as Moodle was not (at all). There is a tool to import Moodle exam questions to Exam but that is so limited that I decided to hand write new exam questions for this year.

This has taken time, also learning how the Exam works since I have never used it before. Also I’ve been preparing new demonstrations and visualizations for the course to aid learning. There’s still one visualization demonstration to do, namely how the Dijkstra’s shortest path algorithm works. If I do not find the time for that, I just have to search for existing demonstrations from the internet. Would like to use the familiar graph examples from the lectures and other demo materials though.

Anyhows, I have solved both Day 1 and Day 2 puzzles in AoC, using Swift as last year. If you wish to see how the actual puzzles look like, just head on to the AoC website.

Yesterday’s part 2 was a bit difficult, mainly due to some basic mistakes I made in the beginning, and not starting from scratch when I saw the mistakes I had “fixed” with unnecessarily complex code. Sauna break in the evening helped, teaching and other work in between less so 😅. And starting from scratch was a good idea.

Day 1 implementations were fast, part 1 took 0.000684708 seconds to execute, part 2 took 0.000698 seconds (on MacBook Pro M2, Swift implementation, release build, obviously). Lines of code I needed for the part 1 solution is 18, for part 2 line count is 32.

Day 2 implementation’s Part 1 (17 lines of code) took 0.150482667 seconds to execute, while part 2 (27 lines of code) took 0.437480584 seconds. Here I was using Swift’s .split, .map, stride (a for loop kind of a thing) and chunks(ofCount:) from Swift Algorithms package. Much more straightforward (for me) than yesterday’s part 2.

Now to lunch, then to prepare for a MSc thesis supervision session, then to teach (remotely, as usual) for the rest of the afternoon.

Archiving old course materials

Returning back to this post from two years ago, I am archiving here the course material which was last updated in March 1999. Course was on programming a multiple document interface Windows app with C.

The material, written as a short booklet, instructs the student to implement, step by step, an app to draw simple shapes. The app also uses components as the drawing code is placed in a dynamic library (dll).

The material ends at the point the app can be used to draw simple lines in multiple windows.

Students are supposed to extend the functionality to draw other simple shapes, filled or not, and saving and reading the drawings to/from files.

Unfortunately I think I’ve lost the code and the .doc file for this material. Don’t even have a Windows PC anymore so… Could try out if the code still works, using Windows in virtual machine on my Mac. Would this still be compatible with current Windows API:s, don’t know.

Slippery Weather watchOS app retired

Years ago I developed a watchOS app Slippery Weather (Liukkaat kadut in Finnish) displaying pedestrian slippery weather alerts to users. I sold it at the App Store, and later lowered the price to zero, offering it as a free app.

Slippery weather app on Apple Watch
Apple Watch displaying an alert in a Slippery Weather app widget about slippery weather notification given two hours ago in the city of Oulu.

However, I didn’t have time to maintain it, so I took it off the App Store recently. That was a good decision, since I’ve now learned that the service providing the alerts API has ceased to operate.

The service got the slippery weather condition alerts from the participating cities (road maintenance folks) in Finland. It seems that the cities have switched to using Finnish Meteorological Institute (FMI) weather model based alerts instead.

I do have a prototype watchOS app using Apple Weather service local weather data. The prototype attempts to predict slippery weather for the next 12-24 hours, based on recent and forecasted temperature, precipitation and humidity. But haven’t had time to work on that either. Doesn’t work so reliably that I would want to publish the app.

Learned a lot while developing the app though. Everything lasts for their allotted time, nothing is permanent.

Monitor demo

I read an interesting question about Monitor structure in Swift Forums. The question was how the way it is implemented in Java using synchronized methods compares to Swift concurrency and actors.

Well since this was interesting and I wanted to learn more, there was simply no other option than to pick up the code editors and start coding…

Result is visible here in Codeberg.org.

Otherwise, the last minutes of the week’ s final student supervision session in Zoom are ongoing, and then — Pizza Friday! 🍷🍕

Have a nice weekend!

Vacation is over

Has been for one and a half months already.

I’ve been busy with preparing the Data structures and algorithms (DSA) course. As mentioned earlier, I decided to remake all the programming tasks, which I did.

Partly they were edited from earlier year tasks. Like the Graphs task is the old 2021 Mazes task with a Pac-Man kind of a game. Each task has the actual algorithm and/or data structure to implement, and additionally a task to apply that in some specific problem solving situation. Another programming task applying a data structure is the implementation of linked list and then using it as a snake in a Snakeses game.

I also decided to remake all the recorded lecture videos. There was a couple of errors in the slides and some content needed revisions and better treatment. So I did that too.

All in all my attempt was to make the course easier to pass without cutting or compromising the learning goals. It has become kind of a bottleneck course in the curriculum when the compulsory prerequisite to a later course was cut away. Now students tend to take it later than before, so the number of students passing has been slightly lower than before. Hopefully this helps, well see.

Courses started two weeks ago and the first deadline of DSA is tomorrow at noon. Students are supposed to deliver the URL to the remote repository where their code will be.

I also remade the tool teachers and students can use to check the code does use the building blocks they should use. Like when implementing a recursive binary search, the tool checks that the function actually calls itself. Another example is a data structure’s toString() -method. There, it must use StringBuilder, not String — since it is thousands of times slower with large number of elements in the collection.

Some checks are made to make sure students do not use loops in various cases where they should cope without. So the tool has a rules file listing all these different kinds of rules to follow:

ArrayQueue.clear,mustnot,for
LinkedListImplementation.toString,must,StringBuilder
FastSort.sort,mustnot,Arrays.sort
BinSearch.searchRecursively,must,searchRecursively
BinSearch.searchRecursively,mustnot,while
BinSearch.searchRecursively,mustnot,for

The implementation then uses the com.github.javaparser library to parse the student code and check if the rules are followed. To avoid false warnings (and to some extent trying to fool the tool), the tool first clears comments and literal string values out of the code, and then analyses if the rules are fulfilled.

—

Otherwise, I’ve been in the usual Fall flu for the past ~25 days. I had to stop running due to that. A week a go I had to visit a doctor due to feeling really odd, like fainting. Nothing was found, except that the white cell levels in blood were a bit elevated. Strange times, strange illnesses.

First run after the break was the on Tuesday this week. I did 5+ km run, and yesterday 4+ km run, totaling a bit over ten km. Hopefully no more sickness this year.

—

Now I’ll have to rush to a teachers’ meeting. Returning back to this blog later, hopefully sooner.

Vacation!

I usually start my summer vacation from Midsummer. This year that’ll mean that the last workday is today 🥳 I’ll be returning to work in the beginning of August.

So far, I’ve been busy in several fronts, including supervising and evaluating MSc theses and planning and organizing the teaching schedules and resourcing for the Fall. We eventually got one half time student assistant to help us in the courses for the Fall semester.

We were required to provide at least some face-to-face teaching for 1st year students, since complaints this study year about only online/remote teaching offered. It is “a bit” difficult to organize classroom teaching when the total number of students is 900+ and there are only two full time teachers and two other teachers who have only some hours allocated for these three large courses (plus one smaller) we need to organize. Especially when the remote possibility is a must, not an option, since these courses have Open University students and students from other Finnish universities participating.

Anyways, we again tried to fulfill these requirements with the little resources we’ve got. In some earlier years, we have had two halftime student assistants, last year only one and that’ll be the case for next Fall too. Not even comparing to 15 years ago when we had like ten+ student assistants helping out in various courses. Things really have changed from those days. Let’s see how we cope this time…

Another big thing I’ve been working on is implementing new programming tasks for my Data Structures and Algorithms (DSA) course. The passing ratio of the course is too low. I am again trying to find new ways to make the course more straightforward to pass.

Last year I made explicit paths to pass the course so that the students could take an easier path with less programming to get the grade 1. If someone wanted a higher grade, then they’d do additional programming tasks. And if someone wanted a high grade (4-5/5), then they were also required to participate in one-to-one evaluation discussion with me, talking through the algorithms and data structures they implemented and analyzed in their reports.

Before last year’s changes, most students got a grade 3-5. After this change, most students got the grade 1, then some the grade 2 and minority got grades 3-5. Not sure which change contributed to what extent to this change in the course output.

Unfortunately, the passing rate did not improve regardless of these changes. Most of the students that fail actually either never start doing anything, or they do at most the 1-2 first programming tasks (which actually were based on the previous prerequisite course contents) and then disappeared. Maybe they just decided that the course is too challenging considering their prerequisite knowledge and skills? Or they had more important courses they prioritized?

One reason may be that DSA is no longer a prerequisite for any other course in the curriculum. A couple of years ago it still was a prerequisite and students needed to pass DSA to get into Programming 3 (server side stuff). That was then required to enter Programming 4 (GUI programming) and via that path, getting in the BSc Project course was not possible without passing DSA first in the chain. As the prerequisite DSA ⇒ Programming 3 was removed, it may well be that DSA will be one of those last ones they try to pass before getting their BSc degrees, together with the compulsory Swedish language course… Maybe the hypothesis was that DSA is useless for the courses coming after it. Not that I agree with that…

The issues of plagiarism and using AI to avoid learning and doing things have somewhat increased during the last 2-3 years. These issues are not too widespread yet (?), but still clearly on the rise. I’ve now used the same programming tasks for two years, and it is apparent that some are getting the solutions copied from somewhere.

Luckily there are lots of students that are willing to do the work and walk the path, regardless of the challenges — always very motivating to the teachers to see. It is very rewarding for us teachers to discuss issues with students, walk them through their problems, seeing their joy of finally solving difficult issues and at the same time see them learn and gain skills that are important for their professional development as software developers.

Items from above were the motivation for me to implement new programming tasks for the DSA course. Most of the task learning objectives are the same as before. I decided to drop the first task that was just revisiting the insertion sort algorithm taught already in the prerequisite course. That algorithm is now given to the students, as they are supposed to know it already. So no two weeks of course time is spent on that anymore.

Instead, the first task focuses on correctness, first of the two important learning goals for the DSA course, the other being time complexity (to some extent also memory complexity). They’ll learn to use invariants to ensure code is behaving correctly, including pre- and postconditions, as well as loop and class invariants, implemented with asserts and thrown exceptions.

I’ve brought back the partitioning algorithm task back from 2021 course implementation. The binary search tree task will be a bit easier; the current task is too challenging because the context of applying it makes it too large a task to do. So that’ll be simplified.

Furthermore, all of the tasks where they apply the generic algorithm or data structure they first implement, will change. There will no longer be a single example app using all those algorithms and data structures they implement. Some students did value this concrete example with a GUI; seeing a real world context where all this they are supposed to learn, is actually used and needed. But for many, this context was too large, too much code to digest and understand, they got confused and felt lost. In the next DSA, each task they go through will be in a separate, small and simple(r) component, focusing only on a specific algorithm or data structure and how to apply it and analyze it.

Another of my goals is also to move the course exams from Moodle to controlled computer exam class. It is apparent that the Moodle exam is too easy to do in a way that doesn’t measure the students’ actual knowledge of the topics. Maybe the new setup does this better, if I manage to prepare the new exams in the new environment in time for Fall…

The new set of programming tasks has 11 different tasks, and I’ve currently (re)implemented five of them:

  • Assess and support code correctness of algorithms by using asserts, pre- and postconditions and loop and class invariants.
  • Recursive binary search, comparing time efficiency with linear search.
  • Partitioning an array using a predicate, filtering utilizing the partitioning algorithm.
  • Quicksort, comparing it with insertion sort and partitioning/filtering, when sorting is not actually necessary.
  • Stack, using stack to check XML correctness (parsing code is given).

That leaves six tasks to be finished in August, before the course begins in September:

  • Queue.
  • Linked list.
  • Binary search tree, applying it to count unique words in Project Gutenberg books / frequency of person names in datasets.
  • Hash tables and hash functions, possible application is the same as with binary search tree, to compare time/memory efficiency of these two ?
  • Using the Set in Java (not implementing it).
  • Something about Graphs (breath/depth first searches?), or leave this to theory only, depending on the estimated student workload.

As usual, all tasks will have automated unit tests and also the code is analyzed by using tools that I’ve discussed in some of my previous posts.

To get all this done in time, it’ll be a busy month in August. Especially when I want to avoid having errors with the material given to students. I should reserve time to test and assess the code and the instructions so that I do not have to post too much errata when the course starts…

In the past, I did use the summer time to do these kinds of teaching development work, but since the past 2-3 years, I’ve decided not to sacrifice myself to work. Vacation time is my time, not the employers.

Hopefully you, dear reader, have also the time to relax during your vacation time, whenever that might be. Have a nice Summer! 🌞 (or Winter if you locate at the other side of the globe, don’t actually know if it is dry or rainy season in between 😃).