I’ve been working on modifications to the Data Structures and Algorithms (DSA) course during this Spring. This is another attempt to make it more possible than before to pass the course for more students than in the past. (A complicated way to say that I am trying to make it easier to pass the course.)
The last programming task on Graphs has previously included implementing the basic graph features (adding vertices and edges) as well as basic algorithms (breadth and depth first searches) and finally Dijkstra’s shortest path algorithm.
Next course implementation gives the students already implemented Directed and Undirected Graph implementations with necessary algorithms. I’ll give the implementations as an obfuscated jar file though, not source code.
Instead of implementing the mentioned algorithms, they’ll use the given algorithms to solve problems. Let’s see if this helps in growing the pass percentage of the course.
The use case story in the new graph programming task is such that…:
“The Finns have grown frustrated to the way things are heading on Earth and have decided to leave the planet, to conquer a little piece of the Galaxy for themselves. Finns have mapped an area of stars and are now planning and budgeting how many portals between pairs of stars they need to build to enable traveling between stars in this little system of theirs.”
Since the Finns are lead by someone from Laihia (the Scotland of Finland), everything must be done as cheaply as possible. So the first problem is to calculate the distances between all the stars, pair at a time, and then arrange them so that the closest pairs are first. Because then the portals are built so that the closest pair of two stars is connected first, then the second closest, etc. This makes building cheaper since not only the two portals needed have a cost, but the cost of maintaining the connection increases as the distance between the stars grow. To maintain the portal connection over longer distances requires more energy, as you can surely understand.
The leader has also set a limit on the number of portals to use in the first phase of conquest. After all the available portals have been used, leader wants to know how many disconnected areas we still have left. One can travel within a connected area, but one cannot travel from a connected area to another area of connected stars, as there is no portal connection between them. As you can see from the image below.
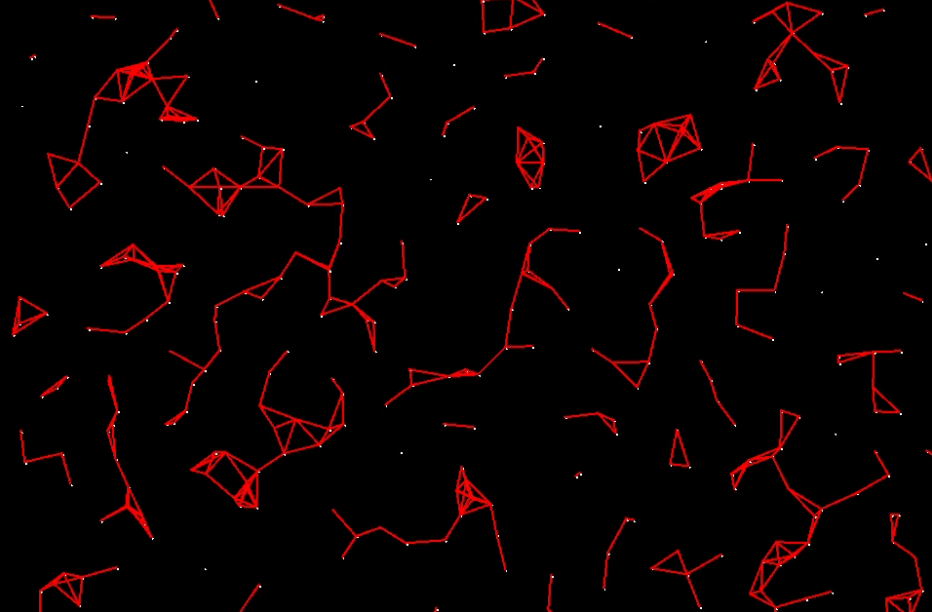
Finns could then build more portals and continue to connect the still unconnected stars from the list of stars in increasing distance order. But that would create connections that are not actually needed for traveling. As you can see from the image above, connected areas contain links between stars that are redundant — one could travel from a star to another using other available connections. So to the disappointment to the leader, we have spent portals and energy to maintain connections not actually needed!
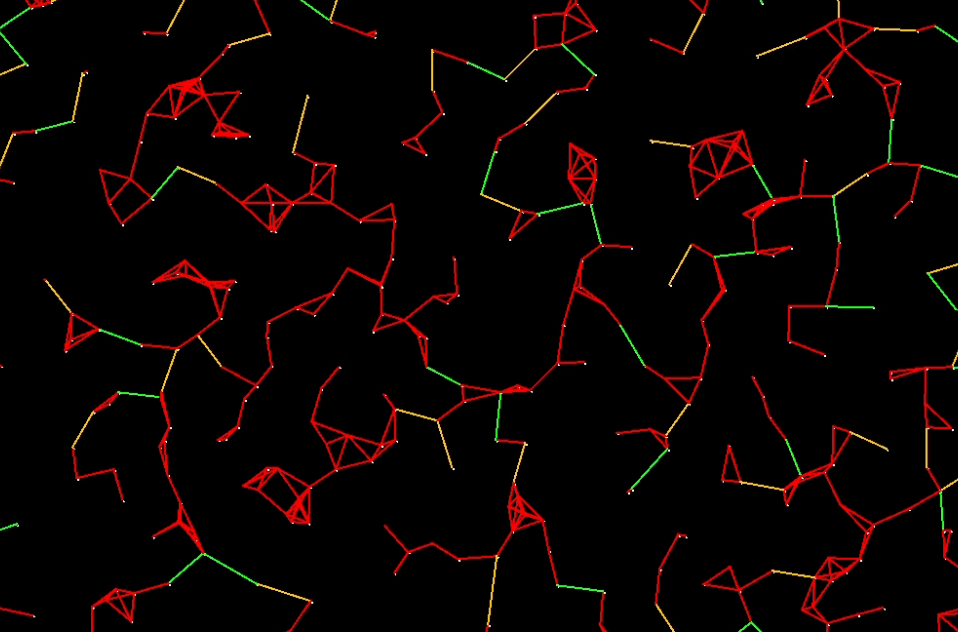
The leader then decides that the disconnected areas should be connected with only one additional portal pair to one other connected area as close as possible.
Taking first the largest connected area A (having more stars than other connected areas) should be connected to another connected area B that has a star that is nearest to some star in A than any other of the connected areas C, D, E,… has.
For example, if you take a look at the image above, and the connected area at the bottom right corner. It could be connected to the area that is above and left, since it seems to be the nearest. Or the triangular area in middle left edge should be connected to the one on the right of it — they are closest to each other.
To enable this, one must first obtain all the disconnected areas and sort them largest first, in descending order by the count of stars in the connected area. Then starting to find the closest areas to connect and do the actual connecting.
There are many ways to do this, but one is to create a minimum spanning tree forest of the graph. Minimum spanning tree has only the necessary links, stripping the redundant ones, but at this point Finns are not interested in that, just the fact that the forest has trees and these trees are disconnected.
Using these disconnected trees, Finns can find the two closest connected areas and add only two portals between two closest stars of area A and B. This connects the two disconnected areas to one larger connected area.
This connecting happens with the original first phase task graph with redundant portals and links, not with the minimum spanning tree forest. Why not with that?
Since dismantling the already built portals also has a cost. Those pesky portal builders get paid not only building things but also from dismantling things. And as the stingy Laihian leader of Finns sees an opportunity to save costs, that opportunity surely will be taken.
After doing this, the whole star system should be connected. That is, you can travel from any star to another star, since there always is a path. Finns can now start counting the beans of traveling from star P to star Q. This can be done using Dijkstra’s shortest path algorithm. Some sample travel costs are then calculated.
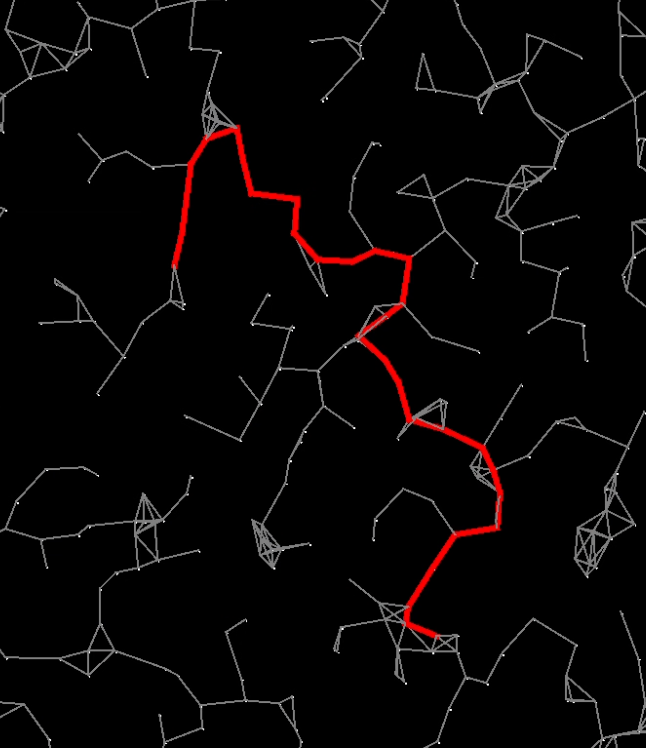
The final task is to try to see if dismantling the redundant portals and links that are not actually needed (see the image again), has a cost advantage. Could Finns sell those portals to someone else with profit and still be able to travel cheaply enough in their system or not? Note that even though the extra portals and connections have a cost, they also may provide shorter routes to travel, thus reducing the travel costs, compared to having only the minimum number of portals/connections.
At this point the whole system is connected, so Finns can again create a minimum spanning tree forest from the graph. This time the forest has only one tree, since there was no disconnected areas. This tree now replaces the original star map graph and we can calculate the costs of traveling having only the bare minimum of connections that are needed.
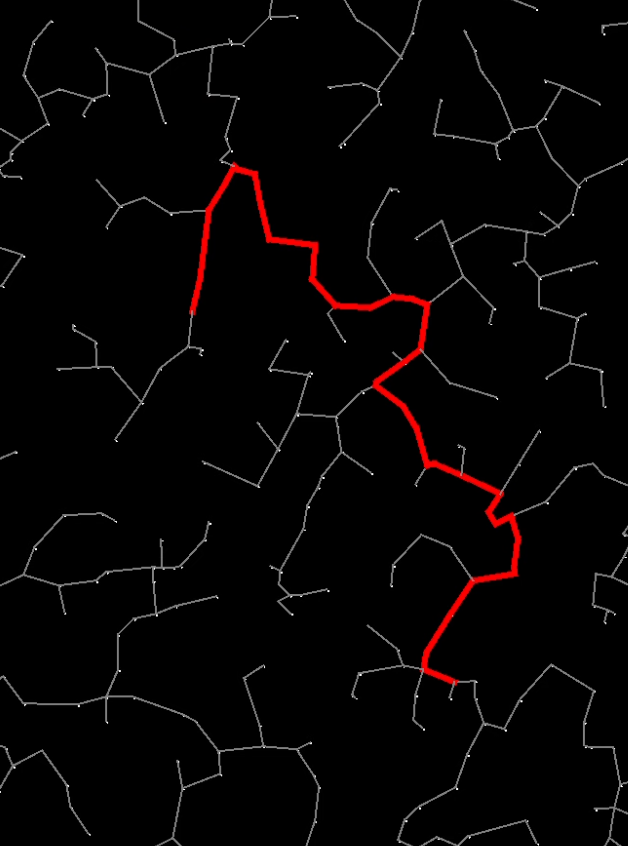
In the end, the task is to see what if the total cost of building portals with some redundancy is cheaper compared to stripping away all redundant connections. In the evaluation, Finns need to calculate both the total cost of building and maintaining the portals, as well as traveling through the system via the shortest paths, either with redundancy or no redundancy at all.
I’ve implemented an example solution for the problems to see that the problems are solvable by the students, and so that I can then assist the student in actually solving the problem.
The video below visualizes in an animation how the different problems are solved. First, the tasks are solved one by one with a small sample star map. After this, a larger star map with 10 000 stars is selected and all tasks are solved in one go.
The learning goals include forming combinations of two of all the stars, calculating distances between them, sorting by distance, selecting a graph implementation (directed or undirected, easy peasy), adding vertices and edges to a graph, forming minimum spanning trees, merging graphs, and then doing searches for shortest paths.
Obviously making sure all is done correctly. Each student will use their own star map file the tools generate to them, and the tests will verify that their result is correct with their specific star map file.
Still WIP, have to make sure everything is easily packaged as a learning task with instructions. And automatically testable with JUnit. Teaching resources are (once again, surprise surprise /s) less than previous years, I have (once again) more work allocated than before, so automation in evaluation and support for independent work for students is really truly needed.