Last year I had 299 students working on their individual git projects in Data structures and algorithms course. It is a challenge to keep up with the status of each student to guide them ahead in the course!
Thinking about this today, I decided to see if I could create some tooling to help me out in keeping in touch on how students proceed in their course projects.
First tool is a bash script to clone or update the projects from GitLab to my local computer. These scripts were written already 2-3 years ago.
Second (new) script goes through the student repositories on my local computer and creates a git log file for each project, with some specific settings:
git log --numstat --branches --date=iso8601 --output=<file>Then I have this Swift/SwiftUI app using the new Swift Charts API to generate a status view for all the student projects from the log files. When I press the Load logs button, all project log files are parsed and simple statistics for each repository is then created from the log files.
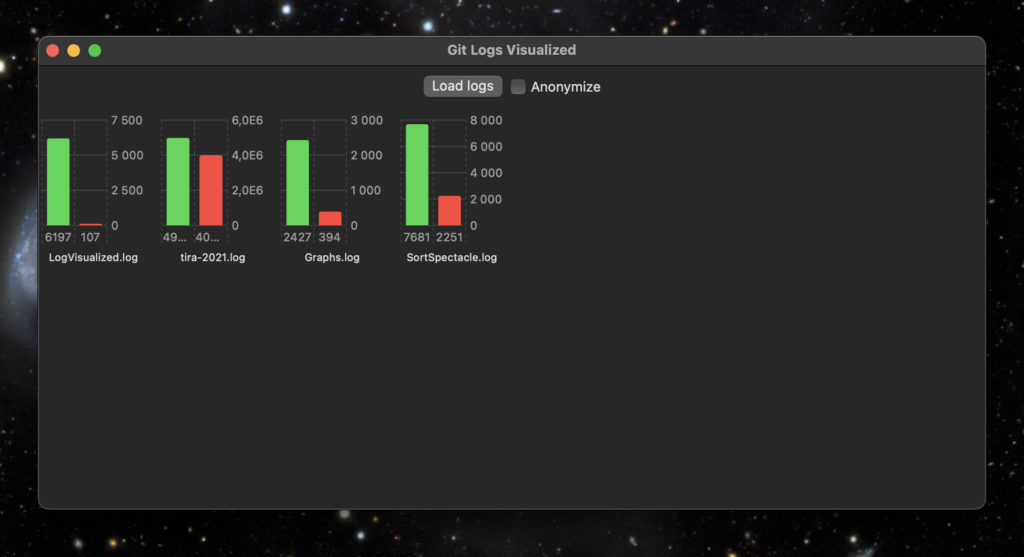
The green bar shows the number of added lines of code so far, the red one shows the number of removed lines of code.
Anonymize -button puts random strings in place of the repository names, in case I need to show the statistics to others that are not supposed to see the student id’s.
Tomorrow starts this Fall implementation of Data Structures and Algorithms. Let’s see if this tool is of any use to us teachers…
When this basic functionality works, I could also add a line chart showing a timeline of individual projects, how lines of code were added when the course proceeds.